
U.S. manufacturers have added 72,000 jobs since December 2025. The rest of the labor market looks far less lively. Employers added only 29,000 jobs in September, and the unemployment rate rose to 4.2%.
Factory work has long been what many working families meant by a good job. Pay often depended on overtime. Some weeks, extra hours meant a noticeably bigger paycheck. Other weeks, there were none to count on.
So when factory hiring holds up in a soft month, three questions follow. How much, compared with what, and for how many hours a week?
What the September Jobs Report Actually Said
The Employment Situation release for September 2026 had little good news in its headline numbers.
Economists surveyed before the release had expected about 84,000 new jobs, according to ABC News. The actual figures came in well short of that.
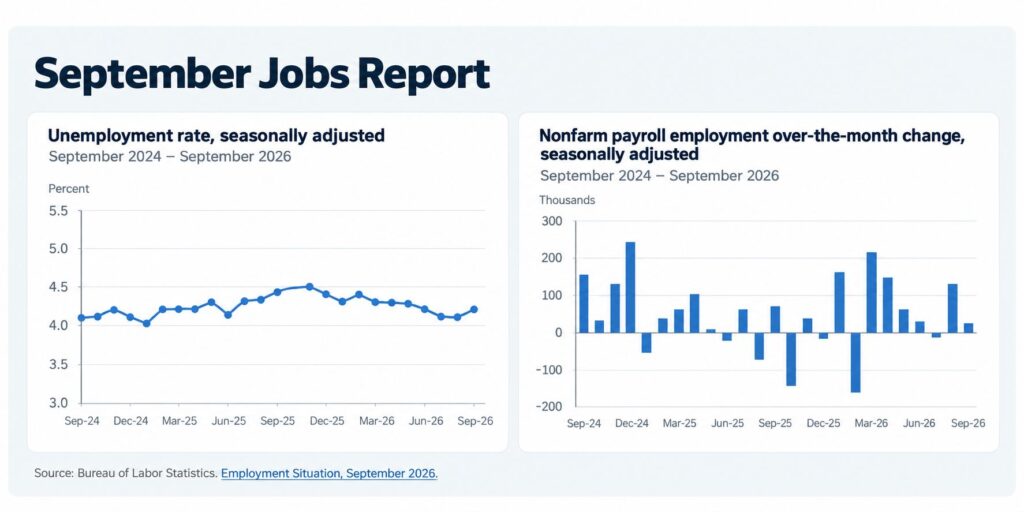
- Total nonfarm payrolls rose by 29,000.
- Unemployment edged up from 4.1% in August to 4.2%, or 7.1 million people.
- July and August were revised down by a combined 60,000 jobs, and July now shows a loss of 10,000.
- Manufacturing added 9,000 jobs, led by plastics and rubber products and machinery, with about 5,000 each.
- BLS noted that manufacturing employment is up 72,000 since a recent low in December 2025.
The September factory gain was modest on its own. The longer run of steady additions is what makes manufacturing stand out against a weak overall picture.
What the 72,000 Figure Actually Represents
Every growth figure depends on where you start counting, and BLS chose a specific point here.
Measuring from a low makes a recovery look as large as it can, much like judging my fantasy baseball team from its worst week of the season.
Factory employment stood at 12,612,000 in September 2025 and 12,652,000 in September 2026. Subtracting 72,000 from the current level puts the December 2025 low at roughly 12,580,000.
Vice President JD Vance highlighted the addition of 72,000 manufacturing jobs during remarks in Ohio, presenting the increase as evidence of a broader industrial recovery. The figure refers to employment growth since the December 2025 low, rather than the total number of jobs added over the past 12 months.
The video below shows how that manufacturing employment gain has become part of the broader debate over the U.S. economy.
Run those numbers forward and the picture gets more modest. Manufacturing lost about 32,000 jobs between September and December 2025, then gained back more than twice that.
Over a full 12 months, the net gain is 40,000. That is still real growth during a soft hiring year. It is simply not 72,000 new jobs from a stable baseline, and the August and September figures remain preliminary.
Factories Are Carrying More Than Their Share
We wanted to see whether factories have punched above that weight, so we added up the monthly payroll changes from January through September 2026 listed in the BLS Economics Daily summary. The total comes to about 612,000 jobs. Manufacturing supplied 72,000 of them, or close to 12% of all net hiring this year, half again its share of employment.
8%
12%
The 12-month view tells a calmer story. Payrolls averaged 45,000 a month over the past year, about 540,000 in total, and the 40,000 factory gain is roughly 7% of that. In plain terms, manufacturing has held its own over the year and outperformed since winter. Both statements are true, and each starts from a different month.
Durable Goods Did Nearly All the Work
The industry detail in the BLS payroll table by industry shows a split factory economy.
Durable goods employment rose by about 84,000 from September 2025 to September 2026, while nondurable goods lost about 44,000.
Here are the biggest year-over-year moves, in my own tally from that table.
- Transportation equipment added about 31,000 jobs.
- Fabricated metal products added about 24,000.
- Electrical equipment and appliances added about 17,000.
- Machinery added about 15,000.
- Food manufacturing lost about 16,000.
- Furniture lost about 11,000, and apparel lost about 7,000.
Plastics and rubber products, one of the September leaders, still sit about 6,000 jobs below their level a year earlier. One good month does not erase a weak year.
The growth sits in heavier, longer-lasting products such as vehicles, metal parts, and electrical gear, while everyday goods like food and clothing keep shedding workers.
The national manufacturing recovery has not been felt equally across the country.
In a video posted on October 20, 2026, Michigan Senator Elissa Slotkin highlighted reported manufacturing job losses in her state and criticized the administration’s economic policies. Her remarks provide a recent regional perspective on why national employment gains do not necessarily translate into stronger factory hiring everywhere.
View this post on Instagram
Factory Paychecks Grew Faster Because of Longer Weeks
Hourly pay and weekly pay can tell different stories, and manufacturing is a good example. The figures below come from the BLS earnings table for all employees, with my own percentage calculations.
| Measure | Sep. 2025 | Sep. 2026 | Change |
|---|---|---|---|
| Manufacturing hourly pay | $35.70 | $36.92 | 3.4% |
| Manufacturing weekly pay | $1,428.00 | $1,498.95 | 5.0% |
| All private hourly pay | $36.70 | $37.81 | 3.0% |
| All private weekly pay | $1,255.14 | $1,300.66 | 3.6% |
Factory weekly pay rose faster than hourly pay because the average workweek stretched from about 40.0 hours to 40.6 hours.
Consumer prices rose 3.7% over the same 12 months, according to the September 2026 Consumer Price Index.
That leaves factory hourly pay slightly behind inflation and weekly pay ahead of it, thanks to the extra time.
Industry averages tell only part of the story. At Boeing, engineers and technical workers recently secured a revised pay deal with a 10% upfront raise and stronger guarantees for future increases.
What a 40.6-Hour Week Means at Home
The September workweek in manufacturing included 3.0 hours of overtime, unchanged from August.
In many factory households, overtime is the number that gets watched most closely. A busy stretch means a tired worker and a budget that breathes a little easier. A slow stretch means fewer extra hours and more careful grocery trips.
The national numbers work the same way. A factory worker earning the average $36.92 an hour picks up about $22 more a week from an extra 0.6 hours at straight time, and more if those hours fall into overtime.
Over a year, that comes to more than $1,100 before taxes. Employers usually add hours before they add people, and they cut hours before they cut people.
A steady 40.6-hour week with stable overtime is a quiet sign that factories are still busy.
What Factory Surveys Say About the Next Few Months

Purchasing managers are still reporting growth. The ISM Manufacturing PMI for September 2026 came in at 54.5, barely below 54.6 in August.
Readings above 50 signal expansion, and the index has now stayed above that line for nine straight months.
The ISM employment index rose from 51.2 to 52.7, which points to continued, if modest, hiring.
The prices index jumped from 71.1 to 77.9, however, a sign that factories are paying more for materials.
The Federal Reserve raised its benchmark rate by a quarter point in September, its first increase in three years.
Higher borrowing costs tend to weigh on equipment orders and factory construction.
All of these are survey readings and policy signals, not job counts, so they describe direction rather than guaranteed hiring.
Where the Rest of the Labor Market Is Struggling

Factory hiring looks better partly because other large sectors have cooled.
The slowdown is particularly difficult for people entering the workforce. Recent college graduate underemployment figures show that about 42% of employed graduates ages 22 to 27 are working in occupations that typically do not require a bachelor’s degree.
- Health care added 17,000 jobs in September, about half its 33,000 monthly average over the prior year.
- Government shed 17,000 jobs, mostly at the local level.
- Financial activities lost another 7,000. The sector is now down 129,000 since May 2025, a decline Salary Data Index has tracked in its look at why the finance industry has been cutting jobs, with most losses at insurance carriers.
- Construction added 11,000, close to its recent pace. Weekly earnings for all private workers have moved up only slightly since the August average weekly pay figure.
Against that backdrop, a steady 9,000 factory gain reads as one of the few stable lines in the report.
What to Watch in the October Report
The next jobs report will show whether manufacturing can extend its run or whether higher interest rates and rising input costs start to slow it.
We will be watching three numbers before the headline. The first is the revised September factory figure, since July and August both moved by tens of thousands overall. The second is the manufacturing workweek, which tends to drop before payrolls do.
The third is the year-over-year factory gain, now 40,000. If it keeps climbing toward the 72,000 measured from December, the recovery is broadening rather than simply bouncing off a low.