
Average weekly earnings for US private-sector workers reached $1,298.60 in August 2026, up $46.20 from a year earlier.
The first question is how much of that increase came from better hourly pay and how much came from a longer working week.
The hourly rate a worker is promised and the money that lands on the paycheck are not the same thing. A bigger weekly total can reflect more hours, higher earnings per hour, or a different mix of jobs. August’s figures need that context.
Education is another part of the earnings picture, although a degree does not guarantee a degree-level position. The latest college graduate underemployment rate shows why educational attainment and actual job requirements need to be considered separately.
Weekly earnings increased by $7.20 from July

The BLS earnings summary shows the two components behind August’s total:
- Average hourly earnings increased to $37.75, from $37.65 in July.
- Average weekly hours increased to 34.4, from 34.3.
- Multiplying $37.75 by 34.4 produces $1,298.60.
Both components increased. Calling the entire weekly gain a raise would therefore misdescribe what the data measure.
Published September 4, these seasonally adjusted estimates were preliminary and remained the latest available on October 1. BLS scheduled September’s employment report for October 2.
During my payroll analytics years, separating pay from hours became a habit.
An employee can receive a larger gross paycheck without an equivalent increase in their hourly rate.
The average includes full-time and part-time jobs
The figure covers employees on private nonfarm payrolls, including full-time and part-time jobs. Government workers, farm workers, and unincorporated self-employed workers fall outside this particular earnings measure.
BLS describes these earnings as gross payroll amounts before deductions. My teenage discovery that taxes existed remains relevant: $1,298.60 isn’t the amount a worker should expect to find in their checking account.
Average weekly earnings are a mean across covered payroll jobs, not the median paycheck or a measure limited to full-time employees.
That distinction is quite important when readers compare themselves with the number. High earners affect the average, and changes in the mix of higher-paid and lower-paid jobs can move it.
A grocery-store job, a warehouse shift, and an analyst position do not belong in one comparison until hours and responsibilities are checked. A national average requires the same mindset.
Purchasing power rose much less than weekly pay

For most workers, the question that matters is simple. What can the paycheck buy?
The September 11 BLS real earnings report gives the answer for August.
- Average hourly earnings increased 3.1% over the year, while consumer prices, measured by CPI-U, increased 3.4%.
- Inflation-adjusted hourly earnings fell 0.3%, while inflation-adjusted weekly earnings rose 0.3%.
The average workweek increased 0.6% over that period. Longer hours helped weekly purchasing power improve even as purchasing power per hour declined.
That is a small improvement with a meaningful qualification. It does not show that the same workers all put in longer hours, since the survey measures aggregate averages. Nor does a national inflation index reproduce what any single household spends. A family budget spreadsheet can track one set of bills, but it cannot stand in for everyone else.
Industry averages range from $603 to $2,420 a week

An overall average explains very little about any particular job. Industry differences make that problem visible.
BLS industry earnings data show the following August averages. Figures are seasonally adjusted and preliminary.
| Industry | Hourly earnings | Weekly earnings |
|---|---|---|
| Utilities | $56.28 | $2,420.04 |
| Information | $55.53 | $2,065.72 |
| Construction | $41.66 | $1,645.57 |
| Retail trade | $26.38 | $791.40 |
| Leisure and hospitality | $23.74 | $603.00 |
Hours explain part of that distance. Dividing weekly earnings by hourly earnings gives 43 hours for utilities and 25.4 for leisure and hospitality, allowing for rounding.
Those are industry averages across different occupations. They don’t mean every utility employee earns $2,420 a week or every hospitality employee works part time.
How, for example, a $107,000 salary compares
Consider the reader example of a $107,000 annual salary and a 40-hour week. Assuming 52 paid weeks, the weekly equivalent is $2,057.69, and dividing annual salary by 2,080 hours gives $51.44 per hour.
Here’s the comparison, using gross amounts throughout.
| Metric | Reader example | National benchmark |
|---|---|---|
| Weekly earnings | $2,057.69 | $1,298.60 |
| Hourly equivalent or earnings | $51.44 | $37.75 |
| Annual salary or annualized earnings | $107,000 | $67,527.20 |
Multiplying the national weekly figure by 52 produces an annualized illustration, not measured annual income or a guaranteed salary. Likewise, the reader’s hourly equivalent assumes the stated schedule. Regularly working beyond 40 hours would lower that effective rate.
What different raises would add to that salary
After a salary negotiation, it is common to spend days wondering whether asking for a few thousand dollars more would have worked. Writing down the actual amounts beforehand gives that worry a more useful job.
For the $107,000 example, possible increases look like this.
| Raise | Added annual pay | New salary | Hourly equivalent |
|---|---|---|---|
| 3% | $3,210 | $110,210 | $52.99 |
| 5% | $5,350 | $112,350 | $54.01 |
| 10% | $10,700 | $117,700 | $56.59 |
| 15% | $16,050 | $123,050 | $59.16 |
The increases listed here are calculation scenarios, not established rates for good performance, promotions, or job changes. Hourly equivalents assume a standard 2,080-hour work year.
Matching the reported 3.4% annual CPI increase would require $3,638 more, producing $110,638. That comparison assumes unchanged hours and uses national inflation rather than the expenses of any individual reader.
A future raise should also reflect the period it covers. The August inflation rate looks backward and is not a forecast for the next year.
Compare your work before choosing a raise target

A matching job title is only the beginning. Two employers can attach the same title to different responsibilities, recruitment problems, and levels of experience.
Four things are worth gathering before a pay discussion.
- Salary evidence for the actual occupation and location.
- A description of responsibilities added since the last review.
- Specific results that show the value of those responsibilities.
- The pay range at your employer and the criteria for moving within it.
BLS occupational wage estimates provide occupation-specific comparisons, including state and metropolitan-area data.
They offer a closer starting point than one average covering the private economy.
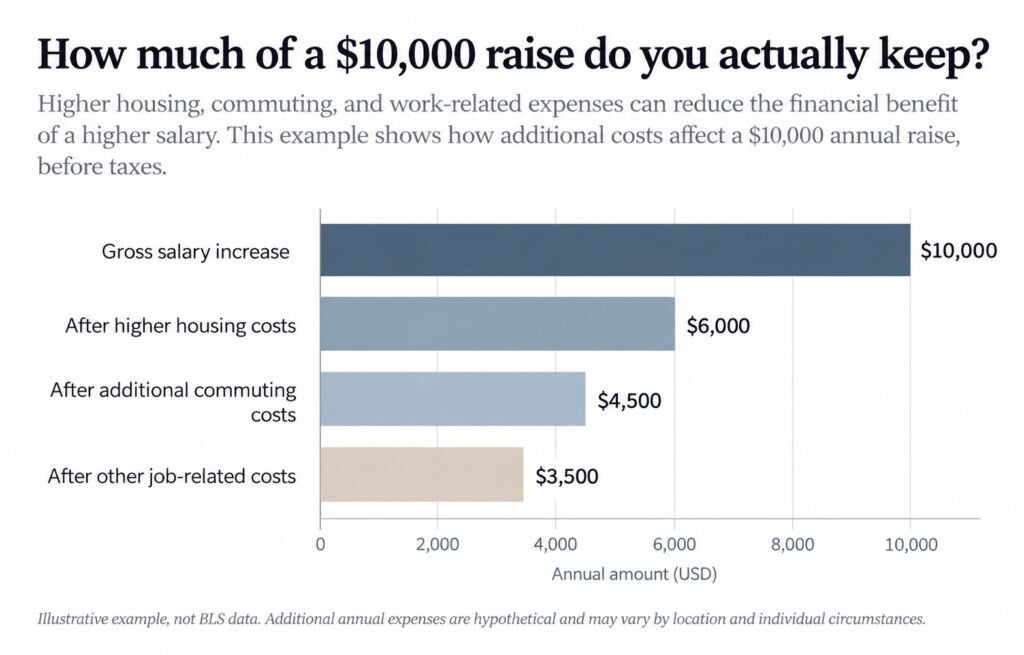
Changing jobs has its own costs. A higher-paying offer that requires relocation can lose its advantage once housing costs are added in.
Another position can taught you to take commuting costs seriously. The offer letter rarely does that arithmetic for you.
Frequently asked questions
Turn to the BLS survey definitions when questions about overtime, bonuses, or benefits come up. Small details can change what we’re actually comparing.
Keep the hours beside the paycheck
The $1,298.60 figure belongs beside its date, hours, and inflation adjustment. August’s weekly earnings improved, but the buying power of an hour’s earnings slipped.
So if you are earning $107,000, I’d take the $51.44 hourly equivalent into the next comparison and match it against similar work in the relevant location.
Then I’d calculate any proposed raise in annual dollars and check the schedule attached to it. My household spreadsheet has survived more than a decade because those details are important.
A larger salary deserves a closer look when it requires more commuting, more expensive housing, or more evenings away from home.