
A salary comparison between two cities is a reason to slow down before deciding what the number means.
The latest one is hard to miss. Workers in the San Francisco-Oakland-Fremont metro averaged $48.19 an hour in May 2025, while workers in Miami-Fort Lauderdale-West Palm Beach averaged $32.30. That is a $15.89 gap.
A difference that large raises two questions. Are the two areas filled with the same kinds of jobs? And does the higher paycheck actually leave a worker better off? The first answer is visible in the wage data. The second requires more caution.
The $15.89 gap is real, but it covers entire metro labor markets
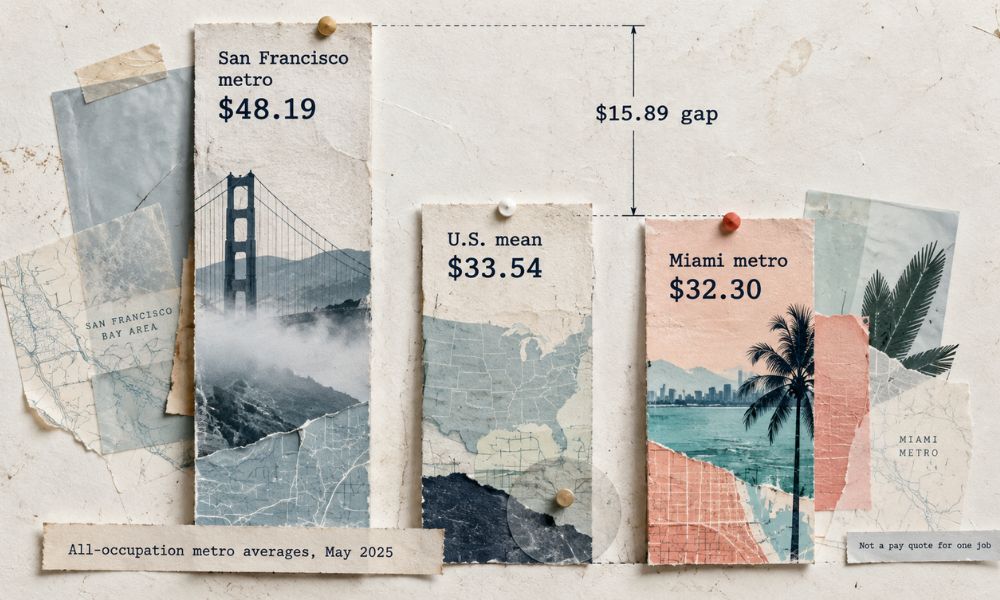
The BLS San Francisco wage release puts the metro’s mean hourly wage at $48.19 for May 2025. The Miami-area release reports $32.30.
The national mean was $33.54. In other words, San Francisco was $14.65 above the U.S. average, while Miami was $1.24 below it.
| Area | Mean hourly wage | Difference from U.S. mean |
|---|---|---|
| San Francisco-Oakland-Fremont | $48.19 | +$14.65 |
| United States | $33.54 | $0.00 |
| Miami-Fort Lauderdale-West Palm Beach | $32.30 | -$1.24 |
They also combine hundreds of occupations into one number. Never use the $48.19 figure as a salary expectation for a specific job without going further.
The average is a starting point, not a pay quote.
Average hourly earnings should not be confused with minimum wage requirements. For example, California’s minimum wage will rise to $17.40 an hour in 2027, establishing a statewide pay floor that is separate from the occupational averages reported by the BLS.
For a broader look at how hourly wages vary across the country, this Instagram Reel ranks all 50 U.S. states by average hourly pay. It offers a useful national perspective, although state-level averages should not be confused with the metropolitan wage figures used in this comparison.
View this post on Instagram
San Francisco has more workers in several high-paying job groups
Job mix is part of the story. San Francisco had 9.4% of its employment in management, 8.7% in business and financial operations, and 6.6% in computer and mathematical occupations.

Miami’s shares were 8.0%, 7.0%, and 2.5%. Miami had larger shares in office and administrative support, sales, and food preparation and serving.
- Office and administrative support accounted for 13.3% of Miami jobs versus 9.5% in San Francisco.
- Sales made up 10.8% in Miami versus 7.5% in San Francisco.
- Food preparation and serving represented 9.9% in Miami versus 8.2% in San Francisco.
Two employers can report the same average salary, but the comparison shifts when one workforce contains more managers, engineers, or technical specialists.
The difference becomes even clearer at the individual occupation level. For example, pediatric surgeons earned an average of $502,050 a year in the May 2025 BLS estimates, showing how highly paid specialties can influence broader wage comparisons.
Even similar occupational groups pay considerably more in San Francisco
Occupational mix does not explain the whole gap. Compare the same broad BLS groups and San Francisco still pays more.
Computer and mathematical jobs averaged $80.51 an hour in San Francisco and $52.51 in Miami.
Management showed a $27.56 difference. Construction and extraction differed by $15.71.
| Occupational group | San Francisco | Miami | Hourly gap |
|---|---|---|---|
| Management | $93.71 | $66.15 | $27.56 |
| Computer and mathematical | $80.51 | $52.51 | $28.00 |
| Construction and extraction | $43.66 | $27.95 | $15.71 |
| Office and administrative support | $32.96 | $23.73 | $9.23 |
| Food preparation and serving | $22.91 | $18.44 | $4.47 |
That gets closer to the question workers ask me: what does my kind of work pay somewhere else?
Even then, a broad group can contain very different occupations and experience levels, so keep drilling down before treating any row as a relocation number.
Miami’s average rose more over the year, while San Francisco barely moved
The previous BLS releases add context. San Francisco’s mean hourly wage was $48.15 in May 2024, according to the prior San Francisco estimate. It reached $48.19 a year later, an increase of four cents. Miami moved from $31.88 in May 2024 to $32.30 in May 2025, based on the prior Miami estimate, a 42-cent increase.
Changes in average wages do not always mean workers received higher pay. The composition of the local workforce also matters. This video from the U.S. Bureau of Labor Statistics explains how occupational wage data can be explored across different geographic areas.
Average wage changes can reflect changes in pay, changes in the mix of jobs, or both. A higher metro average does not mean every worker received a raise.
A headline number can move simply because the workforce underneath it changed. The year-over-year figures are best read as labor-market estimates, not as a record of what happened to one typical paycheck.
A higher hourly wage does not tell you what remains after local costs

A job that pays substantially more can look like an easy decision until housing costs enter the comparison. By the end of a single evening with rental listings, a larger salary can look much less impressive.
The BLS wage figures are not adjusted for local prices. The Bureau of Economic Analysis publishes regional price parities specifically to compare price levels across states and metro areas.
In our comparison of whether higher-paying cities actually leave workers better off, San Francisco’s 53.7% wage advantage over Pittsburgh shrank to 25.8% after accounting for local prices.
California had the highest state-level price parity in 2024 at 110.7, meaning overall prices were above the national level. A worker considering a move should compare occupation-specific pay with housing, taxes, transportation, insurance, and other recurring costs.
What the BLS wage figure includes and leaves out
The $48.19 and $32.30 figures come from the Occupational Employment and Wage Statistics program. The May 2025 OEWS technical notes say the survey covers wage and salary workers in nonfarm establishments and combines six panels collected over three years. The May 2025 estimates use a model-based method covering about 1.1 million establishments across the six panels.
OEWS wages are straight-time gross pay. Base pay, commissions, production bonuses, tips, and some allowances are included. Overtime, severance, shift differentials, nonproduction bonuses, employer benefit costs, and tuition reimbursement are excluded.
Self-employed workers and owners or partners in unincorporated firms are not covered.
A wage rate and the money that reaches a bank account are different numbers. Before comparing a pay statistic with your own compensation, it helps to know exactly what is inside it.
Faqs
At the end
The headline is not simply that San Francisco “pays $16 more.” Its all-occupation mean was $15.89 higher than the Miami mean in May 2025, and the difference shows up inside many broad occupational groups too.
San Francisco also has a heavier concentration of several high-paying job categories, which pulls the overall average upward.
Anyone comparing offers in these two markets can set the headline average aside after the first minute and move straight to the detailed occupation, the employer, and likely monthly costs.
Salary data becomes useful when it gets specific enough to resemble an actual paycheck.