
Pediatric surgeons are the highest-paid workers in America, with an average pediatric surgeon salary of $502,050 a year.
That figure covers the 1,190 pediatric surgeons counted in the May 2025 Occupational Employment and Wage Statistics release from the Bureau of Labor Statistics.
Cardiologists ranked second at $454,940, and the average across all U.S. occupations was $69,770.
We read the table with a calculator and a strong suspicion that the headline number was not the whole story.
A pediatric surgeon earns about $241 an hour on average. The more useful findings sit underneath that figure.
Key Takeaways
- $502,050 is the mean annual pay for pediatric surgeons in May 2025 BLS data.
- $559,030 is the reported median, higher than the mean.
- 1,190 jobs were counted in the national pediatric surgeon estimate.
- The BLS mean excludes certain forms of compensation and self-employed surgeons.
Mean annual wage
Median annual wage
Estimated jobs
What the $502,050 Pediatric Surgeon Salary Actually Measures
The $502,050 figure is a mean, the plain average of every reported wage.
BLS collects pay data from employers, combines three years of survey responses, and converts hourly rates into annual pay by multiplying by 2,080 hours. That conversion assumes a standard 40-hour week, which few surgeons actually work.
The definition of pay matters even more. Years in compensation analysis taught me to read the footnotes before the totals, because two numbers with the same label can measure very different things.
How BLS defines wages. OEWS wages include base pay, cost-of-living allowances, guaranteed pay, hazardous-duty pay, incentive pay such as production bonuses, and tips. They exclude overtime, severance, shift differentials, nonproduction bonuses and employer-paid benefits. The survey does not cover the self-employed or owners and partners in unincorporated firms.
A surgeon who owns a share of an unincorporated private practice is therefore missing from the count entirely.
The 10 Highest-Paying Jobs in America in 2025
All ten of the best-paid occupations in the May 2025 data are physician or surgical specialties. The gap between first and second place is $47,110, larger than many full-time salaries.
| Rank | Occupation | Mean annual wage | Estimated jobs |
|---|---|---|---|
| 1 | Pediatric surgeons | $502,050 | 1,190 |
| 2 | Cardiologists | $454,940 | 17,290 |
| 3 | Radiologists | $381,530 | 26,770 |
| 4 | Orthopedic surgeons | $373,570 | 14,100 |
| 5 | Surgeons | $364,360 | 49,380 |
| 6 | Anesthesiologists | $360,570 | 38,760 |
| 7 | Oral and maxillofacial surgeons | $346,490 | 4,910 |
| 8 | Dermatologists | $323,530 | 11,370 |
| 9 | Emergency medicine physicians | $317,480 | 32,880 |
| 10 | Ophthalmologists | $304,650 | 8,950 |
Outside health care, the top job is airline pilots, copilots and flight engineers at $288,650, followed by chief executives at $269,630, according to the NewsNation ranking republished by Yahoo Finance. Neither reaches the bottom of the medical top ten.
Look at the jobs column, too. Pediatric surgeons form the smallest group on the list by a wide margin.
Pediatric Surgeon Salary Jumped 11.4% in One Year

The number also stands out for a second reason. Pediatric surgeon pay barely moved between 2023 and 2024, then leapt forward in the latest release.
- May 2023 brought a mean of $449,320 across 1,180 jobs, according to the BLS occupation profile for 2023.
- May 2024 showed $450,810 across 1,050 jobs in the April 2025 wage release.
- May 2025 reached $502,050 across 1,190 jobs.
My calculation puts the one-year increase at $51,240, or 11.4%. Over the same period, the mean wage for all occupations rose from $67,920 to $69,770, about 2.7%.
Treat the jump with caution. With roughly 1,100 workers in the estimate, a handful of large employers can move the average.
In 2023, BLS reported a relative standard error of 30.6% on the job count, so even the headcount carries wide uncertainty.
The Median Pediatric Surgeon Salary Is Higher Than the Average
Here the median deserves the interruption, because it is higher than the mean, which is unusual for pay data.
The May 2025 release lists a median of $268.76 an hour, or about $559,030 a year. The May 2025 national OEWS tables show the full spread.
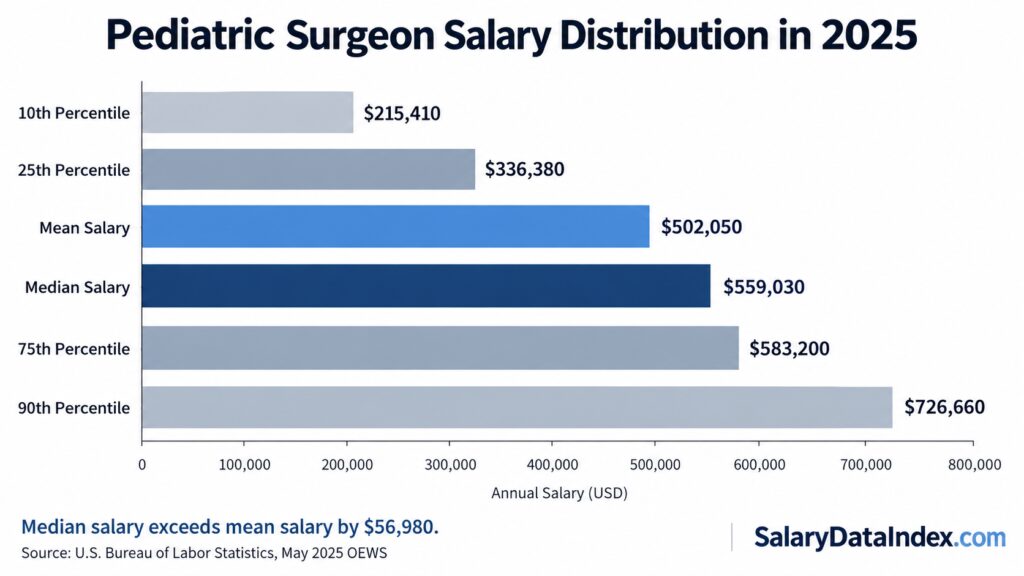
Only $24,170 separates the median from the 75th percentile, while the 25th percentile sits $222,650 lower. A lower-paid group at the bottom drags the mean down.
Two years earlier, BLS left most of these cells blank because they exceeded its $239,200 publication cap.
Why Neurosurgeons Do Not Appear in the Ranking

Job titles are terrible little troublemakers.
Occupation codes cause the same trouble, only at national scale.
BLS publishes separate estimates for a few surgical specialties, including pediatric surgeons, orthopedic surgeons and ophthalmologists.
Neurosurgeons, thoracic surgeons and other specialists fall into a catch-all category called surgeons, all other, which averaged $373,930 in May 2025.
Averaging very high earners with lower-paid specialists flattens that row.
Pediatric surgeons win the national ranking partly because they have their own line in the table. The title “highest-paid workers in America” is accurate for the occupations BLS measures separately.
Whether pediatric surgeons out-earn every individual surgical specialty is a separate question, and the government data cannot answer it.
The same instinct applies whenever someone quotes a salary. Which version of the job?
Private Surveys Put Pediatric Surgery Pay Even Higher
Private pay surveys measure physician income in their own ways, so their numbers differ from federal data. The 2026 Doximity compensation figures reported by Becker’s Hospital Review are a good example.
| Source | Who is counted | Pediatric surgery figure |
|---|---|---|
| BLS OEWS, May 2025 | Employer-reported wages, excluding the self-employed and nonproduction bonuses | $502,050 mean |
| Doximity, 2026 report | Nearly 23,000 self-reported surveys from full-time physicians in 2025 | $627,126 average |
The Doximity pediatric surgeon salary figure is $125,076 higher, or about 25%. Neither number is wrong. Doximity counts full-time physicians working at least 40 hours a week and relies on voluntary responses, while BLS counts employees and leaves out several types of pay.
The same survey places pediatric surgery fifth, behind neurosurgery at $829,161, thoracic surgery and orthopedic surgery.
About 15 Years of Training Come First
This video explains why pediatric surgeons are among America’s highest-paid medical professionals and what makes their work so specialized.
Nobody walks into a $502,050 job. The usual path to pediatric surgery runs through four separate stages.
- A four-year college degree, the typical route into medical school
- Four years of medical school
- At least five years of general surgery residency, as required by the American Board of Surgery
- A two-year pediatric surgery fellowship
Here in Pittsburgh, the pediatric surgery fellowship at UPMC Children’s Hospital of Pittsburgh runs two years and accepts only applicants who have completed five years of general surgery residency. Someone who starts college at 18 reaches the end of that path at 33 at the earliest.
What the Ranking Means for Everyone Else
In one hour, the average pediatric surgeon earns $241.37. The average U.S. worker needs about 7.2 hours to earn the same amount, based on the all-occupation mean of $33.54 an hour. Most paychecks are growing far more slowly, as our report on how U.S. workers earn 3.1% more per hour shows.
Location changes the math for surgeons as well. We all once turned down a higher-paying job after comparing housing costs, and our exciting new salary got mugged by rent. Our comparison of San Francisco and Miami hourly wages shows how far average pay can differ between two large metro areas.
For anyone weighing a specific job offer, state and metro OEWS tables are a better starting point than the national mean. With an occupation this small, though, many of those cells go unpublished.
What to Watch in the Next Wage Release
If your teenager announces a plan to become a pediatric surgeon, start with the $336,380 25th percentile and the $559,030 median rather than the $502,050 headline, then add 15 years of training to the timeline. Those two figures describe a more realistic range than a single average.
BLS typically publishes new OEWS estimates each spring, and the May 2026 numbers will test this headline. Pay holding near $500,000 would point to a real shift in what employers pay pediatric surgeons.
A slide back toward $450,000 would suggest that a sample of about 1,190 workers produced a very large headline. Either way, the household spreadsheet gets another tab.